Business Intelligence Capstone Project
Requirements for Business Intelligence Capstone Project.
A company produces three types of alarm systems – S1, S2, and S3 – and supplies them to a retailer. It is contractually obligated to meet the demands of the retailer for each alarm system. Because of limited capacity the company may not have sufficient machining, assembly, and finishing time available to satisfy the entire demand in each period through its regular production runs. Contractual obligation requires the company to make up the shortfall in production through special production runs at higher costs. The company aims to meet the retailer’s demands at minimum cost.
LP Formulation:
SOLUTION DOWNLOAD OPTION – 1 (TASK 1-6)
| Task 1: (10 Points)
Formulate a linear programming (LP) model that may be solved to identify the optimal production plan for the company in each time period. |
Specifically, you must define the decision variables, objective function, and constraints in your LP model using the following parameters:
In each time period, for each product :
- is the demand (number of units required) for product .
- is the cost (in dollars) for producing each unit of product in a regular run.
- is the cost (in dollars) for producing each unit of product in a special run.
- is the machining time (in minutes) required to produce each unit of product .
- is the assembly time (in minutes) required to produce each unit of product .
- is the finishing time (in minutes) required to produce each unit of product .
Further, assume that:
- hours of machining time is available for regular run.
- hours of assembly time is available for regular run.
- hours of finishing time is available for regular run.
LP Parameter Estimation:
You must now use available data to estimate the parameters of the LP formulated in Task 1.
Estimation of , , , and :
The text file “production.csv” contains 7 columns: SerialNo, BatchNo, ProductCode, MachineTime, AssemblyTime, FinishTime, and Cost. Using any DBMS of your choice, create a table PRODUCTION with SerialNo as its primary key and the 6 other columns as attributes and insert the 15,000 records from production.csv into the table. SerialNo is a unique identifier assigned to each unit produced by the company; ProductCode specifies the product type; BatchNo identifies the batch in which an item is produced (items are produced in batches of 10 units of a product type); MachineTime, AssemblyTime, and FinishTime specify the time (in minutes) taken by each process (machining, assembly, and finishing) to produce a unit; the last attribute, Cost, specifies the cost (in dollars) of producing the unit in a regular run.
| Task 2: (10 Points)
Formulate an SQL query to obtain the average machining time, assembly time, finishing time, and cost per unit for each product type as estimates of the parameters , , , and of the LP model. |
In your report, you must:
- Specify your SQL query to obtain the estimates.
- Specify your parameter estimates in the table below. Round all estimates to 1 decimal place.
| Parameters for | Product type | ||
| Regular Production | S1 | S2 | S3 |
| Machine Time ( ) | |||
| Assembly Time ( ) | |||
| Finish Time ( ) | |||
| Regular Cost ( ) | |||
Estimation of special run cost :
It is known that the regular production cost is a linear function of the machining, assembly, and finishing times for each product type. That is, , where is the fixed cost incurred to produce each unit of , and , , and are respectively the costs per minute for machining, assembly, and finishing each unit of product during regular run.
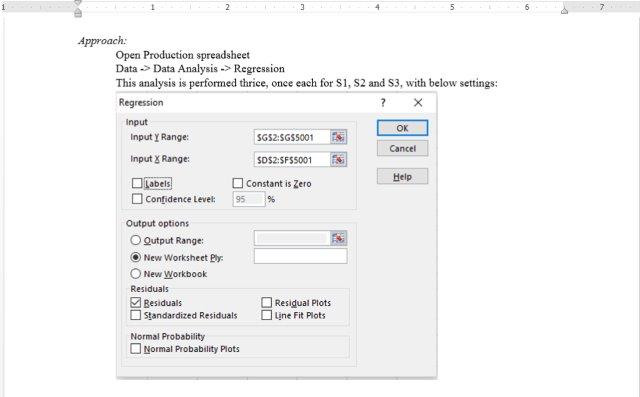
| Task 3: (6 Points)
Run regressions to estimate the coefficients , , , and for each product . |
In your report, please explain how you obtained the data for the 3 regressions to estimate the coefficients. Then present your parameter estimates in the table below. Round all estimates to 1 decimal place.
| Coefficients for | Product type | ||
| Regular Production | S1 | S2 | S3 |
| Intercept ( ) | |||
| MACHINE TIME ( ) | |||
| ASSEMBLY TIME ( ) | |||
| FINISH TIME ( ) | |||
The fixed costs associated with the production of each unit of is the same under the regular and the special run, but the cost per minute for machining, assembly, and finishing are 50% higher in the special run than for the regular run.
| Task 4: (4 Points)
Use the above relationship to estimate that the cost for producing each unit of product in a special run as . |
Present the estimates in the following format:
| Product type | S1 | S2 | S3 |
| Special production cost per unit ( ) |
Estimation of demand
The text file “demand.csv” contains the retailer’s sales data by region (North, South, East, and West) for the three alarm systems over the last 52 time periods. For example, the first row shows that 119 units of S1 were sold in the East region in time period 1, and the last row shows that 177 units of S3 were sold in the West region in time period 52.
Create a table called DEMAND with a composite primary key made up of the attributes Period, ProductCode, and Region. Sales is the fourth attribute in the DEMAND table. Insert all 624 records from demand.csv into the DEMAND table.
| Task 5: (10 points)
Extract the data needed for predicting demand for S1 by formulating an SQL query that lists the Period and the sum of the total sales for S1 from all four regions in each of the 52 time periods as S1demand. Similarly, formulate two more SQL queries to obtain the 52 records for S2demand and S3demand. |
In your report, specify the 3 SQL queries to obtain S1demand, S2demand and S3demand.
| Task 6: (10 Points)
Use the results returned by the queries formulated in Task 5 in forecasting models to predict the demands in time period 53 for each product. |
You should consider various prediction and forecasting methods that you are familiar with. Use the method that you think is most accurate in estimating demands. In your report, please present the estimates for time period 53 in the following format:
| Product type | S1 | S2 | S3 |
| Demand ( ) in period 53 |
Optimal LP Solution:
SOLUTION DOWNLOAD OPTION -2 (TASK 7-10)
| Task 7: (10 Points)
Solve the LP formulated in Task 1 using the parameters estimated in Tasks 2, 4, and 6 to determine the optimal production plan for period 53. |
Report the minimum production cost achievable, number of units of each product type to be produced under the regular and special production runs, and the resources used during regular run in the following format:
| Minimum cost attainable: |
| Number of units produced | S1 | S2 | S3 |
| Regular Run | |||
| Special Run |
| Resources in regular run | Minutes used |
| MACHINE TIME | |
| ASSEMBLY TIME | |
| FINISH TIME |
Sensitivity Analysis:
| Task 8. (3+12 = 15 Points).
Perform sensitivity analysis by changing one parameter at a time (leaving all other parameters fixed at the values used in Task 7) and answer the following questions. (a) By how much does the total production cost change as the demand for each product type changes by 1 unit? (b) At most how much should the company be willing to pay to (i) Increase the availability of machining time by one hour during regular run? (ii) Increase the availability of finishing time by one hour during regular run? (iii) Increase the availability of assembly time by one hour during regular run? |
Quality Control
The text file “defective.csv” contains 2 columns. The first column DefectiveID is an identifier, and the second column SerialNo specifies the serial number of a defective product. Create a table DEFECTIVE with DefectiveID as its primary key and insert all 591 records from defective.csv into the table. Note that SerialNo in the DEFECTIVE table is a foreign key that references the primary key in the PRODUCTION table.
The text file “quality.csv” contains 5 columns containing data from quality control tests run on 1500 batches of items produced. Create a table QUALITY with BatchNo as its primary key and Test1, Test2, Test3, and Test4 as its other 4 attributes. Insert all 1500 records from quality.csv into the table. Note that BatchNo in the PRODUCTION table is a foreign key that references the primary key BatchNo in the Quality table.
Any batch that contains more than one defective items is deemed to be of poor quality; a batch with at most one defective item is considered to be of good quality.
| Task 9: (10 Points)
Formulate an SQL query that lists all 5 columns from the QUALITY table and adds a derived column BatchQuality that contains “Poor” if the batch is of poor quality (contains at least 2 defective items) and “Good” otherwise. |
In your report, include:
- The SQL query for task 9
- The results of the query in a file csv.
| Task 10: (10 Points)
Use the data obtained from Task 9 to train and test a Classification Tree that predicts BatchQuality based on values of the features Test1, Test2, Test3, and Test4. |
In your report:
- Specify the rules that you obtained in Task 10 in the canonical form:
IF …. THEN …
- Present the classification accuracy of this set of rules in the form:
| Number of batches | Actually Poor Quality | Actually Good Quality |
| Predicted Poor Quality | ||
| Predicted Good Quality |
If you wish, you may also use other prediction and classification methods (such as Logistic Regression, Neural Nets, and Discriminant Analysis) to classify BatchQuality based on values of the features Test1, Test2, Test3, and Test4, and comment on the classification accuracy of these methods.
Summary of deliverables:
- File Format: Microsoft Word Document .doc
- Paper Format: Question Answer
- Custom Solution Available: Click on "Custom Solution Writing" if you wish the tutor to write fresh solution for you and not pre-done answers
- Solution Delivery Time for Custom Paper: 24-48 hours