IS 640 R Data Mining Project Solutions
Objectives of this project
- Use Random Forests, Neural Networks and Support Vector Machines to predict loan status (default or not).
- Understand the difference between in-sample fitting and out-of-sample predictive performance.
- Use two cross-validation methods to assess analytic model performance.
Save this file on your desktop as yourlastname_640DM.docx.
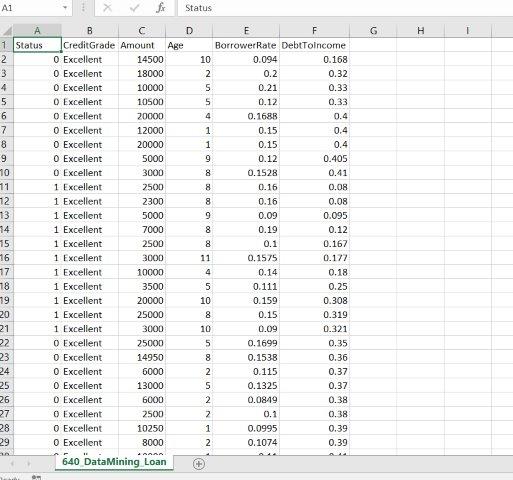
- Load the Loan.csv data set into R. It lists the outcome of 850 loans. The data variables include loan status, credit grade (from excellent to poor), loan amount, loan age (in months), borrower’s interest rate and the debt to income ratio. Code loan status as a binary outcome (0 for current loans, 1 for late or default loans). Display the column names from the loan data set. Fit the loan data set using random forest function. Copy the trained random forest model and the confusion matrix from R and paste it below. [10 points]
- Randomly select 750 out of 850 loans as your training sample. Use the remaining 100 loans as your test set. Train the 2nd random forest model using the training set. Apply the 2nd model to the test set to predict loan status. Compare your predictions to the true loan statuses (using table function). Display the confusion matrix below. Based on this confusion matrix, what’s the overall misclassification rate? [10 points]
- Fit the loan data set using an artificial neural network. Use six neurons in the hidden layer of the ANN. Set maxit to 1000. Use table function to compare in-sample predictions to the true loan statuses. Display the confusion matrix below. [10 points].
- Use the training sample (750 randomly selected loans) to build the 2nd artificial neural network. Use six neurons in the hidden layer of the ANN. Set maxit to 1000. Use table function to compare out-of-sample predictions to the true loan statuses (use the remaining 100 loans as your test set). Display the confusion matrix below. [10 points].
- Use the training sample (750 randomly selected loans) to build a model of support vector machine. Use table function to compare the SVM’s out-of-sample predictions to the true loan statuses (use the remaining 100 loans as your test set). Display the confusion matrix below. [10 points].
- Randomly shuffle the loan data set. Run 10-fold cross-validation to evaluate the out-of-sample performance of Random Forest, ANN and SVM. Based on your cross-validation results, which model has the best out-of-sample performance? Please briefly explain why. [30 points]
- Run leave-one-out cross-validation to evaluate the performance of random forest algorithm in predicting loan status. Why does it take much longer to run leave-one-out cross-validation than to run ten-fold cross-validation? Based on the result of your leave-one-out cross-validation, how many loans are misclassified by the random forest model?[20 points]
Please save your word file as a pdf file named yourlastname_640DM.pdf. Submit the pdf file through the drop box in your Canvas account.
- File Format: MS-Word .docx
- Version: 2013