Python program Twitter Happiness Score with Histogram
By completing this assignment, you will gain skills relating to
using functions,
complex data structures,
nested loops,
text processing,
file input and output,
exceptions in Python.
Task: In this assignment, you will write a complete program in Python that analyzes twitter information. With the emergence of Internet companies such as Google, Facebook and Twitter, more and more data accessible online is comprised of text. Textual data and the computational means of processing it and extracting information is also increasingly more important in areas such as business, humanities, social sciences, etc. In this assignment, you will deal with textual analysis.
Twitter has become very popular, with many people “tweeting” aspects of their daily lives. This “flow of tweets” has recently become a way to study or guess how people feel about various aspects of the world or their own life. For example, analysis of tweets has been used to try to determine how certain geographical regions may be voting – this is done by analyzing the content, the words and phrases, in tweets. Similarly, analysis of key words or phrases in tweets can be used to determine how popular or unpopular a movie might be. This is often referred to as sentiment analysis.
In this assignment, you will build a program that will perform simple sentiment analysis on Twitter data. The Twitter data contains comments from individuals about how they feel about their lives and comes from individuals across the continental United States. The objective is to determine which timezone (Eastern, Central, Mountain, Pacific; see below for more information on how to do this) is the “happiest”. To do this, your program will need to:
Analyze each individual tweet to determine a score – a “happiness score”.
The “happiness score” for a single tweet is found by looking for certain keywords (given) in a tweet and for each keyword found in that tweet totaling their “sentiment values”. In this assignment, each value is an integer from 1 to 10. The score for the tweet is simply the total of the “sentiment values” divided by the number of keywords found. If there are none of the given keywords in a tweet, it is just ignored.
The “happiness score” for a timezone is just the total of the scores for all the tweets in that region divided by the number of tweets.
A file called tweets.txt contains the tweets and a file called keywords.txt contains keywords and scores for determining the “sentiment” of an individual tweet. These files are described in more detail below.
File tweets.txt
The file tweets.txt contains the tweets; one per line (some lines are quite long). The format of a tweet is: [lat, long] value date time text where: [lat, long] – the latitude and longitude of where the tweet originated. You will need these values to determine the timezone in which the tweet originated. value – not used; this can be skipped.
date – the date of the tweet; not used, this can be skipped.
time – the time of day that the tweet was sent; not used this can be skipped.
text – the text in the tweet.
File keywords.txt
The file keywords.txt contains sentiment keywords and their “happiness scores”; one per line. The format of a line is: keyword, value where: keyword – the keyword to look for.
value – the value of the keyword; values are limited to 1, 5 and 10, where 1 represents very “unhappy” and 10 represents “very happy”. (you are free to explore different sets of keywords and values at your leisure for the sheer fun of it!).
Determining timezones across the continental United States
Given a latitude and longitude the task of determining exactly the location that it corresponds to can be very challenging given the geographical boundaries of the United States. For this assignment, we simply approximate the regions corresponding to the timezones by rectangular areas defined by latitude and longitude points. Our approximation looks like:
So the Eastern timezone, for example, is defined by latitude-longitude points p1, p2, p3 and p4. To determine the origin of a tweet, then, one simply has to determine in which region the latitude and longitude of the tweet belongs. The values of the points are:
p1 = (49.189787, -67.444574)
p2 = (24.660845, -67.444574)
p3 = (49.189787, -87.518395)
p4 = (24.660845, -87.518395)
p5 = (49.189787, -101.998892)
p6 = (24.660845, -101.998892)
p7 = (49.189787, -115.236428)
p8 = (24.660845, -115.236428)
p9 = (49.189787, -125.242264)
p10 = (24.660845, -125.242264)
Functional Specifications:
Part A: Developing code for the processing of the tweets and sentiment analysis.
1. Your program should prompt the user for the name of the file containing the keywords. It should check to make sure that the file exists and if does not exist your program should generate an exception and exit.
2. Your program should then input the keywords and their “happiness values” and store them in a data structure in your program (the data structure is of your choice, but you might consider a list).
3. Your program should then prompt the user for the name of the file with tweets; again, your program should generate an exception if the file does not exist. Suggestion: you might wish to have a small file of tweets, just a portion of the full file, for the testing of your program.
4. You should then process the file of tweets, computing the “happiness score” for each tweet and computing the “happiness score” for each timezone. You will need to read the file of tweets line by line as text and break it apart. The string processing functions in Python (see Chapter 7) are very useful for doing this. Your code should not duplicate code. Determine places that code can be reused and create functions. Your program should ignore tweets with no keywords and also ignore tweets from outside the time zones.
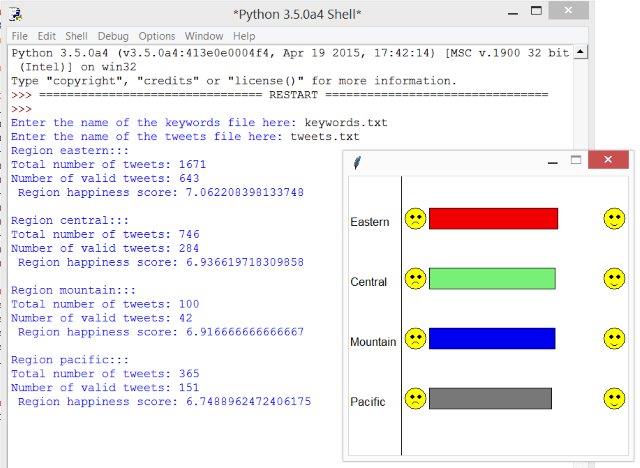
5. Once you have completed processing the entire file, you should print out:
The “happiness score” for each timezone.
The number of tweets found in that timezone.
Part B (mostly for fun):
Once you have implemented your sentiment analysis program, you can now extend the program to include a simple (but fun) graphical display. This part of the assignment will make use of the given Python code in graphics.py and happy_histogram.py; these can be found on the course web site for Assignment #3.
The Python code graphics.py is the graphics package described in the book; you can look in the text for examples (see Chapter 2, section 2.6).
The Python code happy_histogram.py does simple graph plotting using graphics.py. You will need to import happy_histogram.py into your program. It makes a number of assumptions, so make sure to read the comments in the code about the parameters and limitations of the functions. It contains three functions:
– drawSimpleHistogram which will create a histogram of four values in a graphics window; it assumes that the values are in the range of 0-10.
– drawHappyFace which draws a happy face on the histogram as determined by drawSimpleHistogram.
– drawSadFace which draws a sad face on the histogram as determined by drawSimpleHistogram.
Additional Information
For both files it is advised that when you read in the files you the line below to avoid encoding errors. open(“fileName.txt”,”r”,encoding=”utf-8″) or open(‘fileName.txt’, encoding=’utf-8′, errors=’ignore’)
Non-functional Specifications:
1. Include brief comments in your code identifying yourself, describing the program, and describing key portions of the code.
2. Assignments are to be done individually and must be your own work. Software may be used to detect cheating.
3. Use Python coding conventions and good programming techniques, for example:
Meaningful variable names
Conventions for naming variables and constants
Use of constants where appropriate
Readability: indentation, white space, consistency
Leave a Reply
- File Format: Python .py
- Version: 3.5
i cannot open the file
Dear Hengyi Zeng,
Please open the file with a Python shell or a Python editor. You may write to us at info@libraay.com for further assistance.
Team Libraay.