C++ Program for Mutual Fund Analysis
Using classes, writing constructors, using strings, and problem analysis.
Program Overview
The goal of this assignment is to perform analysis on two mutual funds and make a “buy”, “sell”, or “hold” recommendation. This is the type of analysis that a financial analyst would make. And in turn, make recommendations to his/her clients. The clients would pay the financial analyst for this information. You will perform the analysis by looking at two mutual funds. A mutual fund is an investment vehicle consisting of shares of various stocks and/or bonds. The net asset value (NAV) of a mutal fund is the value of one share of a mutual fund on a given date. The NAV is determined for each fund at the market close based on the value of all the stocks and/or bonds that the fund holds.
Required to use the two classes, Nav and MutualFund, and the main() function listed below.
Required Classes
class Nav // Net Asset Value
{
string date;
float nav;
public:
NAV(const string&);
…
// Should add more functions
};
const int HistorySize = 300;
class MutualFund
{
string ticker;
NAV* history[HistorySize];
public:
MutualFund(const string& ticker_, const string& historyFile);
~MutualFund();
void report() const;
…
// Should add more functions
};
The Required main() function
int main()
{
MutualFund vtsmx(“VTSMX”,”vtsmx.csv”); // Constructor arguments are ticker and NAV history file name
vtsmx.report();
MutualFund vbmfx(“VBMFX”,”vbmfx.csv”);
vbmfx.report();
}
Program Requirements
Input data (http://finance.yahoo.com/quote/VBMFX/history?ltr=1) or (http://finance.yahoo.com/quote/VTSMX/history?ltr=1).
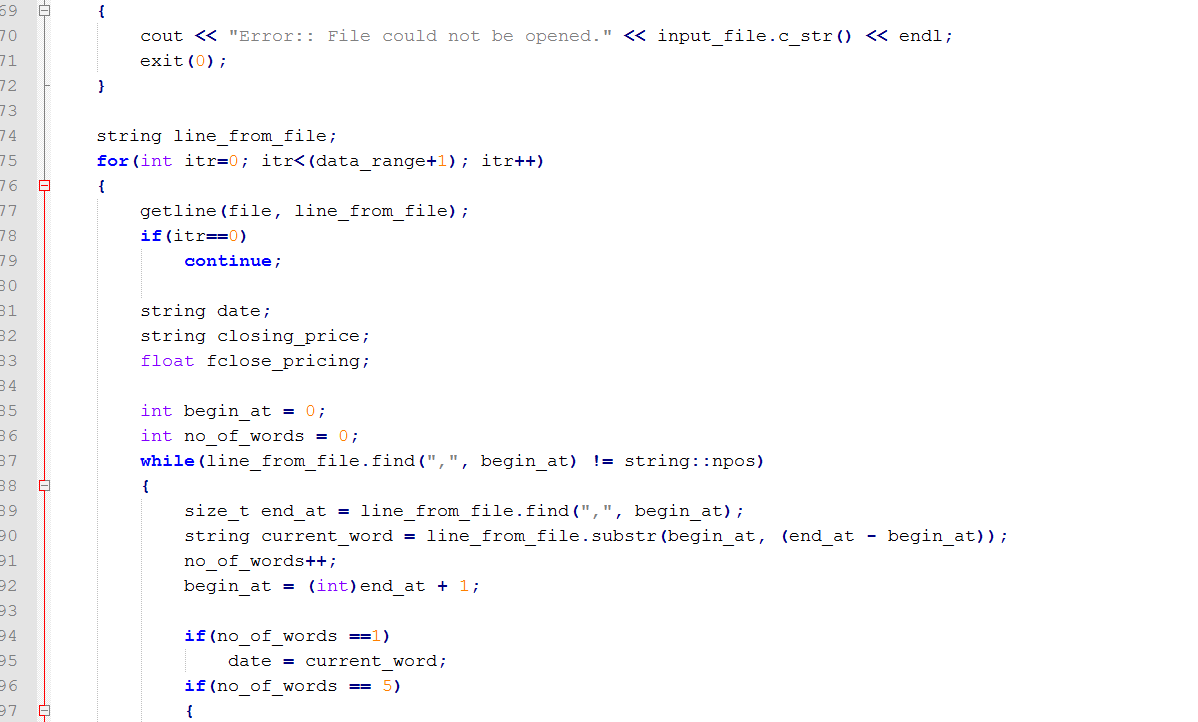
May not modify the contents of the historical data source file. This file will look like this:
Date,Open,High,Low,Close,Volume,Adj Close
2016-10-28,52.950001,52.950001,52.950001,52.950001,000,52.950001
2016-10-27,53.09,53.09,53.09,53.09,000,53.09
2016-10-26,53.310001,53.310001,53.310001,53.310001,000,53.310001
2016-10-25,53.450001,53.450001,53.450001,53.450001,000,53.450001
2016-10-24,53.700001,53.700001,53.700001,53.700001,000,53.700001
2016-10-21,53.439999,53.439999,53.439999,53.439999,000,53.439999
2016-10-20,53.450001,53.450001,53.450001,53.450001,000,53.450001
2016-10-19,53.529999,53.529999,53.529999,53.529999,000,53.529999
2016-10-18,53.389999,53.389999,53.389999,53.389999,000,53.389999
2016-10-17,53.07,53.07,53.07,53.07,000,53.07
2016-10-14,53.209999,53.209999,53.209999,53.209999,000,53.209999
2016-10-13,53.23,53.23,53.23,53.23,000,53.23
– Program must store data for the last 300 market days. Only required to store the Date and the Close price for each mutual fund.
– Use only string objects and string functions to handle all of the text input and output.
-Use the two mutual funds, VBMFX and VTSMX for your solution.
May not use
– C code
– cstring functions
– stringstream objects or functions
Program Output
Output should look quite similar to the following. Note: the values will be different when using current mutual fund history
Output produced 10/28/16 (contains Mutual Fund data through 10/28/16)
| Fund: VTSMX Analysis Date: 10/28/16 Latest Close: $52.95 Minimum for the last year = $45.03 Maximum for the last year = $54.84 50 day moving average = $53.86 200 day moving average = $51.66 % gain over 200 Day Moving Avg: 2.5% Recommendation: Hold Fund: VBMFX |
Program Notes
The Analysis Date is the most recent date in your history data file.
The Latest Close is the must recent Close in your history data file.
The Minimum for the last year represents the minimum Close in the last year. For example, if your Analysis Date is 10/30/15, then you must use the dates between 10/31/14 and 10/30/15 (inclusive) for your analysis. Keep in mind that 10/31/15 may not be a market day.
The Maximum for the last year will use the same rules as the Minimum for the last year.
The 50 day moving average is the average over the last 50 market days.
The 200 day moving average is the average over the last 200 market days.
The % gain over 200 Day Moving Avg is the percent gain of the Lastest Close over the 200 day moving average.
The Recommendation uses the % gain over 200 Day Moving Avg. The Recommendation is:
Buy if the % Gain is < -5%,
Sell if the % Gain is > 5%,
otherwise Hold.
- File Format: C++ .cpp
- Version c++11

