CITS1401 Computational Thinking with Python Project 1: Rainfall Statistics
The Government of Australia established the Bureau of Meteorology (“BOM”) in 1906 under the Meteorology Act which, at the time, brought together the state meteorological services. The main objective of the BOM is to provide weather services to Australia and its surrounding
areas. A research group in UWA requires a computer program which can read the data from a csv (comma separated values) file and return different statistical aspects of the rainfall recorded in the Perth metropolitan area. Your task is to write this program which will meet the following specification.
Specification (i.e. what your program will need to do)
Input:
Your program must define the function main with the following signature: def main(csvfile, year, type):
The input arguments to this function are:
• csvfile is the name of the CSV file containing the record of the rainfall in Perth which needs to be analysed. The first row of the CSV file will contain the headers. From the second row, the first value of each row contains the station number of the Bureau of Meteorology, and the second, third and fourth values will contain the year, month and day respectively. The last value of the row will contain the recorded rainfall in millimetres. We do not have prior knowledge about the number of days of rainfall (i.e. the number of rows) that the CSV file
will contain.
• year is the year or years for which we are looking to analyse. This input argument will accept an integer as a year if the third input requires statistical analysis of a particular year. Otherwise this input argument will contain a list of two integers containing two years for
which a correlation is to be calculated instead.
• type is the input argument which mentions which type of analysis are required. It can take only one of the two string inputs: “stats” or “corr”. If third input argument is “stats”, then the objective of the program is to find the statistical analysis of a single year. Otherwise
if the third input argument is “corr” then the objective of the program is to find the correlation of statistical data of two years.
Output:
The function is required to return the following outputs in the order provided below:
• A list containing the minimum recorded rainfall (that is greater than zero) for each month of the year (i.e. the year provided as the second input argument) if third input is “stats”.
Otherwise if the third input parameter is “corrs”, then the output should be a single value that is the correlation of the minimum recorded rainfalls of the two years (that are provided as a single list in second input argument).
• A list or value in the same fashion as the above that contains or is the correlation of the maximum recorded rainfall.
• A list or value in the same fashion as the above that contains or is the correlation of the average recorded rainfall.
• A list or value in the same fashion as the above that contains or is the correlation of the standard deviations in recorded rainfall
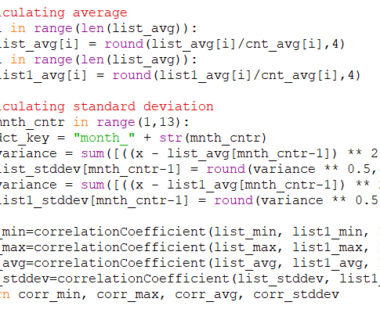
All returned lists should have the values recorded for each month of the year in order from January to December. All returned output values (both in lists and individual) must contain numerical values rounded to four decimal places (if required to be rounded off). Please do not round the values during calculations. Instead round them only at the time that you save them into the final output variables.
Examples:
Download the sample_rainfall_data.csv file from the folder of Project 1 on LMS or Moodle. Some examples how you can call your program from the Python shell (and examine the results it returns) are:
>>> mn1,mx1,avg1,std1 = main(‘sample_rainfall_data.csv’,2019, “stats”)
Your program’s outputs (that will be stored in the variables) are:
>>> mn1
[0.2, 0.2, 0.2, 3.0, 0.2, 0.2, 0.2, 0.2, 0.2, 0.8, 0.2, 0.2]
>>> mx1
[4.8, 0.2, 3.4, 23.4, 7.2, 58.0, 44.2, 28.0, 13.8, 9.0, 13.0, 1.8]
>>> avg
[0.2323, 0.0071, 0.2, 1.4733, 0.5742, 7.0667, 3.5032, 3.6839, 1.0467, 0.5742,
0.6133, 0.0774]
>>> std
[0.8946, 0.0371, 0.6584, 4.4946, 1.6568, 12.4251, 8.3301, 7.563, 3.1806,
1.7029, 2.4684, 0.324]
>>> mn2,mx2,avg2,std2=main(‘sample_rainfall_data.csv’,[2019,2018],”corr”)
Your program’s outputs (that will be stored in the variables) are:
>>> mn2
-0.0916
>>> mx2
0.0677
>>> avg2
0.7229
>>> std2
0.254
Assumptions:
Your program can assume a number of things:
• Anything that is meant to be a string (i.e. header row) will be a string, and anything that is meant to be a number (i.e. data) will be a number.
• The order of columns in each row will follow the order of the headings provided in the first row. However, the rows may be in random order (i.e. they will not necessarily be in date order) and their number are not constant across different testing CSV files.
• No data will be missing in the csv file except recorded rainfall. You can presume the missing recorded rainfall as zero.
• It is not mandatory that rainfall is recorded all days of the month or year. Therefore, while finding average or standard deviation for record of a month, you are required to not to make assumptions about the missing days’ data.
• If there is no recorded rainfall over a month then consider it to be zero. The minimum will also be considered as zero which cannot be the case otherwise.
• The main() function will always be provided with valid input parameters.
• The formula for standard deviation and correlation can be found at the end of the project sheet.
- File Format: .py
- Fresh Solution Available: Yes, write to info@libraay.com to place order for customized solution