IS 571 R and Python
1. Load the LoanData.csv data set into R. It lists the outcome of 5611 loans. The data variables include loan status (current, late or in default), credit grade (from best rating AA to the worst one, HC for heavy risk), loan amount, loan age (in months), borrower’s interest rate and the debt to income ratio. Code loan status as a binary outcome (0 for current loans, 1 for late or default loans). Code debt-to-income ratio into three levels (‘low’ for ratio<10%, ‘medium’ for ratio between 10% and 30%, ‘high’ for ratio above 30%). Fit the recoded data set using logistic regression. Use Credit.Grade, Amount, Age, Borrower.Rate and Debt to Income Ratio (recoded) as the explanatory variables. Copy the glm summary output from R and paste it below. [10 points]
2. Evaluate in-sample fitting of your logistic regression model using .5 as the cutoff probability. Display the confusion matrix below. The cutoff probability should be around 92.43% with symmetric costs of misclassification. Why? Display the confusion matrix using the updated cutoff probability below. What’s the overall in-sample misclassification rate in this case? [10 points]
3. Randomly select 4611 out of 5611 loans as your training set. Apply the fitted logistic model to the 1000 loans from your test set. Choose the appropriate cutoff probability assuming symmetric costs of misclassification [see step 4]. What’s your out-of-sample prediction accuracy rate based on the test set’s confusion matrix? [10 points]
4. Sort the 1000 loans in your test set according to the predicted default probabilities in decreasing order. Use a FOR loop to calculate the lift. Then plot the lift chart for your test set. [10 points]
5. Calculate the out-of-sample prediction accuracy rate for 20 random test samples (sample size=1000). Display the 20 accuracy rates and their mean below. [10 points]
6. Please briefly explain why Naïve Bayes classifier is considered as a naïve implementation of the Bayes’ Theorem? [10 points]
7. Import Python nltk and random packages. Load the movie_reviews corpus (1000 positive files and 1000 negative files) from nltk. How many words are there in this corpus? What are the two movie review categories? For more details about this corpus, run movie_reviews.readme( ). [5 points]
8. Create a Python list named “documents.” Each list element contains the words used in a movie review and the review’s category. Randomly shuffle the list. [5 points]
9. Create a list named “word_features” that contains the 2000 most frequent words in the overall corpus. These 2000 words should not include stop words or punctuation marks. [5 points]
10. Define the document_features function that shows whether each review file contains any of the 2000 most frequent words. Apply the function to each element of the “document” list, and then create a list named “featuresets” that combines each review file’s document features with its category. [5 points]
11. Split “featuresets” into test_set (the first 100 review files) and the train_set (the other 1900 review files). Apply nltk’s NaiveBayesClassifier to the train_set. What’s the trained model’s out-of-sample prediction accuracy for the test_set? Show the top 15 most informative words for the Naïve Bayes’ classifier. [10 points]
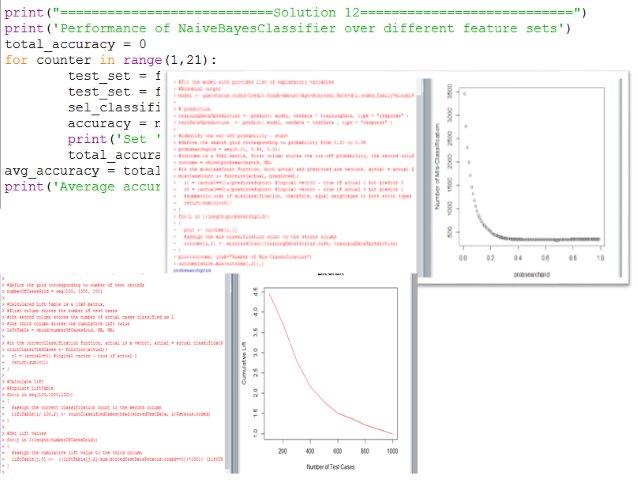
12. Use twenty fold cross validation to show how the Bayes’ classifier performs over different subsets of “featuresets.” Display the twenty out-of-sample prediction accuracy rates and the overall prediction accuracy (i.e., the average of the twenty accuracy rates). [10 points]
- File Format: .r, .py, .txt, .docx
- Custom Solution Writing Available: Yes, write to info@libraay.com for fresh solution