Office 2016 MyITLab MS-Excel Grader EX16_XL_CH08_GRADER_CAP_HW – Customer Satisfaction 1.4
-----View all Office 2016 MyITLab Grader Digital Solution Download Files-----
-----Purchase MS-Excel 2016 MyITLab Grader Discounted Bundle Here-----
-----View all Office 2016 MyITLab Grader Digital Solution Download Files-----
You have been hired to analyze the effectiveness of a local restaurant’s drive-through service. As part of your analysis, you will evaluate customer satisfaction. You hypothesize that customer satisfaction decreases as wait time increases. You also believe there is a correlation between the quality of the food and overall satisfaction. You have collected a cross-section sample of 30 customers’ wait time and satisfaction level surveys based on the range of 1 to 5, with 1 being least satisfied and 5 being most satisfied. You have also pulled a random sample of 10 surveys to evaluate wait time satisfaction.
Instructions:
For the purpose of grading the project you are required to perform the following tasks:
| Step | Instructions | Points Possible |
| 1 | Download and open the file named exploring_e08c1CustomerService, and then save the file as exploring_e08_grader_h1_LastFirst, replacing LastFirst with your name. | 0.000 |
| 2 | In the Survey worksheet, enter a conditional function in cell M3 to calculate average satisfaction of service for store 251 (cell L3). Format the results with the Number Format with two decimal points. | 10.000 |
| 3 | Use the fill handle in cell M3 to copy the function down to complete the calculations. Be sure to use the appropriate mixed or absolute referencing. | 4.000 |
| 4 | Enter a function in cell M11 to calculate the number of survey responses in which restaurant 251 (in cell L11) received a 2 or less (in cell L10) in wait time and service. | 9.000 |
| 5 | Use the fill handle in cell M11 to copy the function down to complete the calculations. Be sure to use the appropriate mixed or absolute referencing. | 4.000 |
| 6 | Use the RANK.AVG function in cell N3 to calculate the rank of store 251 based on the averages in the range M3:M5. | 6.000 |
| 7 | Use the fill handle to copy the function down the column. Be sure to include the appropriate absolute or mixed cell references. | 2.000 |
| 8 | Click the Wait Time worksheet and enter a function in cell F6 that calculates the wait time value of the first quartile. | 9.000 |
| 9 | Copy the function down to complete the column and return to the Survey worksheet. | 3.000 |
| 10 | Select the range J4:J8. Enter a function in the range J4:J8 to calculate the frequency of service ratings from 1 to 5 received by all restaurants. | 6.000 |
| 11 | Enter a function in cell G11 to calculate the correlation between columns C and E. | 9.000 |
| 12 | Format the results as Number Format with two decimal positions. | 2.000 |
| 13 | Click the Wait Time worksheet and enter a function in cell E3 to calculate the standard deviation between satisfaction scores of the wait time sample. | 9.000 |
| 14 | Enter a function in cell F3 to calculate the variance between satisfaction scores of the wait time sample. | 9.000 |
| 15 | Ensure the Wait Time worksheet active. If necessary, display the Analysis ToolPak. Click the Data tab and select Data Analysis. Select Covariance and click OK. Complete the input criteria using the wait time and customer satisfaction data in columns B and C. Set the output functions to display in cell E10. Do not include the column labels in the range. Resize the columns as needed to display the results. | 10.000 |
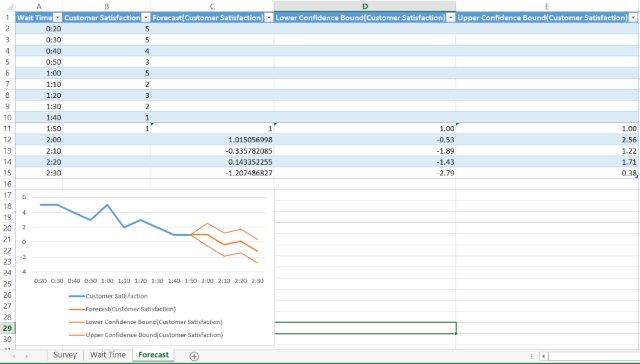
| 16 | Create a Forecast sheet that predicts customer satisfaction ending at a duration of 2:30 based on the time-series data provided in columns B and C. Name the newly created worksheet Forecast and resize the chart to fill the range A17:C30. | 3.000 |
| 17 | Click the Survey worksheet. Click the Data tab and select Data Analysis. Select Histogram and click OK. Use the survey data in the range C4:E33 as the input range. Use the ratings in the range G4:G8 as the bin range. Output the data in cell G14. Be sure to include a cumulative percentage and chart in the output. | 5.000 |
| 18 | Save the workbook. Submit the workbook as directed. | 0.000 |
| Total Points | 100.000 |
Leave a Reply to Team Libraay Cancel reply
- File Format (Solution File): MS-Excel .xlsx
- Version: 2016
- File Format(Guide): .PDF
I already bought this from my phone. Its already been taken off my debit card why cant I access this? or how do i access this? I bought it through pay pal
Dear Richard Weldon,
Please check your E-Mail for a purchase receipt from us. A web link has been sent across to you in the E-Mail, please click on it to get access to your download.
If you still face any issues, feel free to write to info@libraay.com.
Team Libraay
Do you not offer where there is a step by step instructions on what to do on each one? You had it in the previous ones where you have to pay $5 more. Example is that the Apartment Complex one has step by step solutions.
Dear Chanda,
You may place an order for the tutorial guide for this project by writing to info@libraay.com.
Thank You.
Team Libraay